7QC TOOLS:
The seven quality control (QC) tools are fundamental instruments used in process and quality improvement initiatives, particularly within manufacturing and other operational environments. These tools help identify, analyze, and address quality-related issues
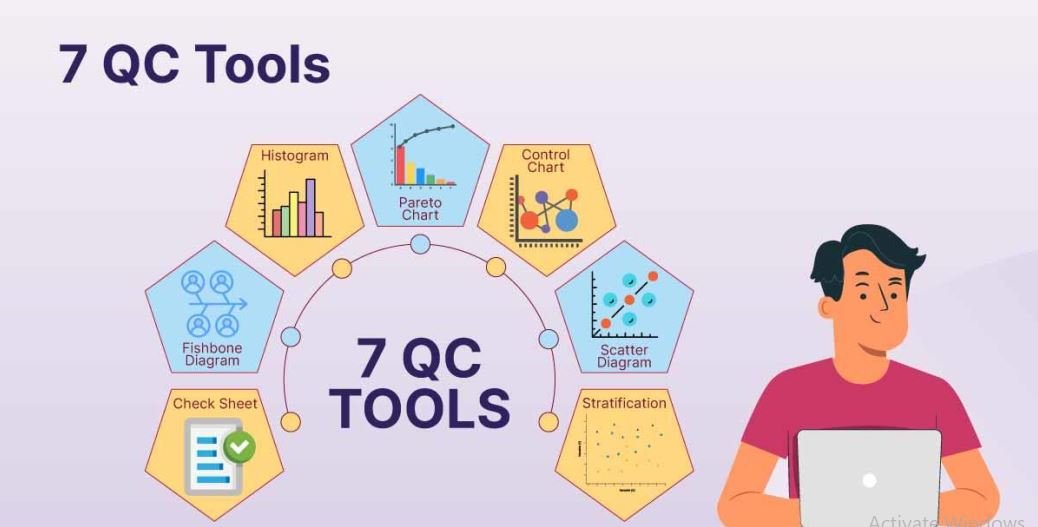
List of Tools
1. Cause-and-Effect Diagram (Ishikawa/Fishbone Diagram): Purpose: Identifies and organizes potential causes of problems in a structured way Use:Helps teams brainstorm and categorize causes of issues to find root causes.
2. Check Sheet: Purpose: Collects and analyzes data systematically. Use:Useful for data collection and recording the frequency of events or defects.
3. Control Chart: Purpose: Monitors process behavior over time. Use:Helps determine the stability of processes and identify variations.
4. Histogram: Purpose: Graphically displays the distribution of data. Use:Helps visualize the frequency distribution and identify patterns or anomalies.
5. Pareto Chart: Purpose: Highlights the most significant factors in a data set. Use:Focuses on identifying and prioritizing problems or causes to focus efforts on the most impactful areas (80/20 rule).
6. Scatter Diagram: Purpose: Shows the relationship between two variables. Use:Helps identify correlations and potential cause-and-effect relationships.
7. Flowchart (Process Diagram): Purpose: Visualizes the steps in a process. Use:Aids in understanding, analyzing, and improving processes by mapping out steps and identifying bottlenecks or inefficiencies.
"These tools are widely used in quality management and continuous improvement projects, enabling teams to systematically address quality issues and enhance overall process performance."